arivis Scientific Image Analysis

AI Image Analysis for Volume Electron Microscopy

Request Free Trial
CASE STUDY

FIB-SEM Volume Electron Microscopy

Focused ion beam scanning electron microscopy (FIB-SEM) is a powerful imaging tool that achieves resolution under 10 nm. Though it produces highly detailed 3D image volumes, one drawback is that it is difficult to use standard image processing segmentation algorithms to detect many cellular structures of interest. This is largely because FIB-SEM highlights the entirety of the cell, generating images dense with cellular features, structural edges, and varying pixel combinations. Due to this difficulty, quantitative analysis of FIB-SEM data often relies on manual drawing of features of interest on 2D slices of a 3D image volume. Though this manual approach can be used to identify and reconstruct 3D objects from the image volume, it is tedious and time-consuming.

Bild1

Authors: Andrew Bergen, Mariia Burdyniuk, and Chris Zugates, arivis

Dataset: Anna Steyer and Yannick Schwab, EMBL

FIB-SEM by ZEISS

AI-assisted Volume EM Analysis

Previous work has focused on moving beyond this reliance on manual annotation to segment cellular structures from FIB-SEM image volumes. Notably, Gunes Parlakgül et al. (2022) recently took a deep-learning approach to identify mitochondria, nucleus, endoplasmic reticulum, and lipid droplets within FIB-SEM image volumes of liver cells. The resulting neural network models trained on these organelles is a leap toward a comprehensive automated cell-profiler workflow for FIB-SEM image data, where the models could be used on multiple image volumes to efficiently quantify these organelles. Here, we take a similar deep-learning approach, with our goal being the development of a cell-profiling workflow that uses neural-network training and image analysis tools that are readily accessible to researchers and do not require coding.

In this study, we highlight the use of ZEISS arivis Cloud and arivis AI toolkit (formerly the APEER online deep learning platform - www.apeer.com) in combination with ZEISS arivis Pro (formerly Vision4D) image analysis software toolkit to facilitate automated profiling based on both large and small structures within a FIB-SEM image of a HeLa cell. We used the arivis AI toolkit in the cloud (formerly APEER) to train neural networks that identify large organelles: mitochondria and the nucleus. We manually drew a subset of the instances of these cellular features and trained neural-network models that successfully predicted the remainder of the instances of cellular features within the FIB-SEM image volume. These AI-driven models were first used to infer mitochondria and the nucleus in ZEISS arivis Pro (formerly Vision4D). We then buikt an analysis pipelines in arivis to filter and improve the initial inferences into usable 3D segments (See workflow chart below for steps of the Vision4D pipelines).

workflow_chart_NEW

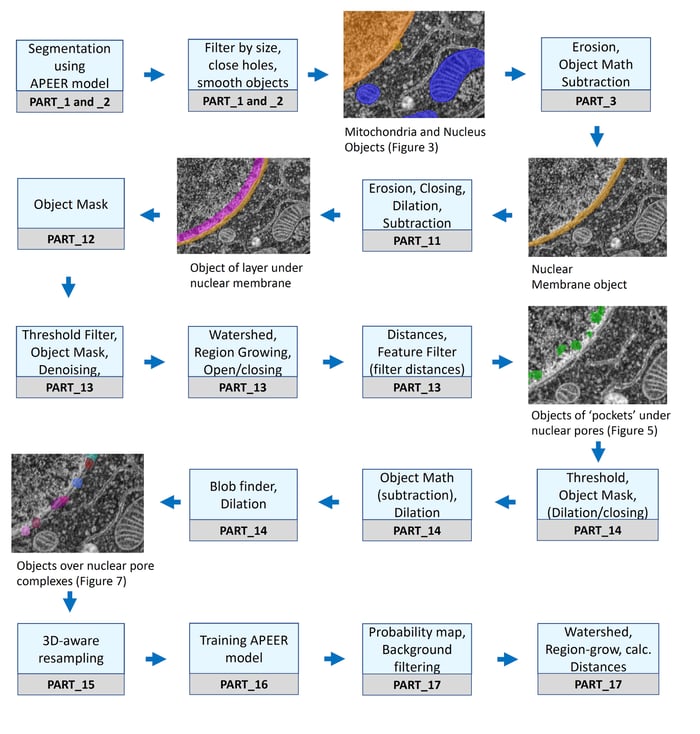
Workflow chart of ZEISS arivis PRO (formerly Vision4D) pipelines used for segmentation of cellular structures.: Each PART labeled under the steps refers to a specific pipeline (see below for availability of detailed workflow and example dataset).

Having defined mitochondria and nucleus, we used the measurement and visualization tools in ZEISS arivis Pro (formerly Vision4D) to examine the cytoplasmic organization of the HeLa cell. We noticed that, even though our images are of low quality compared to current state-of-the-art FIB-SEM, we could visualize the nuclear membrane and the nuclear pores and sought to develop a method to assess their distribution.
Our method uses 3D operations to enhance and segment 3D spatially resolved nuclear pore complex (NPC)-associated objects in a way that is not possible by segmenting each 2D plane separately within the image stack. A series of pipeline workflows in ZEISS arivis PRo (formerly Vision4D) provided the NPC regions of the nuclear membrane. 

To ensure accurate segmentation, we performed NPC segmentation on the subset of the stack and used these objects for neural network training that respects the 3D nature of the data. In the final part of the workflow, we used this deep learning model to reconstruct the probability map of the NPC positions and segment the nuclear pores for the entire nucleus. Overall, this work highlights how the deep learning model approach, when combined with the powerful 3D tools of ZEISS arivis Pro (formerly Vision4D), enables 3D segmentation and measurements within FIB-SEM image sets.

Request Free Trial

Workflow Steps

  1. Determine which organelles can be robustly segmented from a FIB-SEM image, with the current 2D deep learning approach (preferably without the need for more than a 2 person-days of human proof-editing), and produce valid objects for cell profiling
  2. Upon identifying nucleus, mitochondria, and other segment-able organelles, perform segmentation, proof-editing, and measurements (nucleus, mitochondria, whole-cell, cytoplasm, etc.). Comparisons of the basic properties of these objects comprise the simplest component of a cell profile.
  3. Compute features of organelles (surface-to-volume ratios) and visualize organelles colored by their computed characteristics, to evaluate certain custom features and visualizations to determine if these can make higher information components of a cell profile.
  4. Compute distances between objects and associate 3D distances with computed characteristics to form an objective, measured spatial classification of organelles.
  5. Determine whether the current 2D deep learning approach can assist a ZEISS arivis Pro (formerly Vision4D) 3D segmentation of smaller, highly oriented structures.
  6. Use ZEISS arivis Pro (Formerly Vision4D) to create 3D segmented structures of nuclear pores, 3D-aware sampling deep learning models trained on 2D for the automatic, 3D segmentation of all organelles of interest.
  7. Perform distribution/cluster analysis of small, uniform, highly distributed structures (nuclear pore basket and underlying nucleoplasm)
  8. Scale-up of automatic segmentation and assay/profiling in ZEISS arivis Hub (formerly VisionHub)

Materials and Methods

FIB-SEM HeLa Cell Volume EM

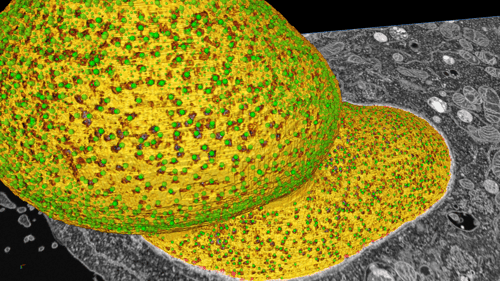
The image set was collected using a ZEISS Auriga Crossbeam FIB-SEM, resulting in a nm-resolution image volume of the HeLa cell (Figure 1A). To initially examine the data and begin 3D analysis, we inverted the pixel intensities (Figure 1B) to achieve positive signals in a dark background. Subsequent analysis operation functions were then, for the most part, working on positives, which makes the whole of analysis-building easier to conceptualize. Of course, since much of the image is background (non-stained cellular structures and resin), this also makes it easier for humans to focus on structures of interest (think traffic lights, dark mode, etc.). Importantly, 3D volumetric renderings of the image volume do not make sense without a positive signal in black background (as seen in Figure 1C-D).

Figure_1

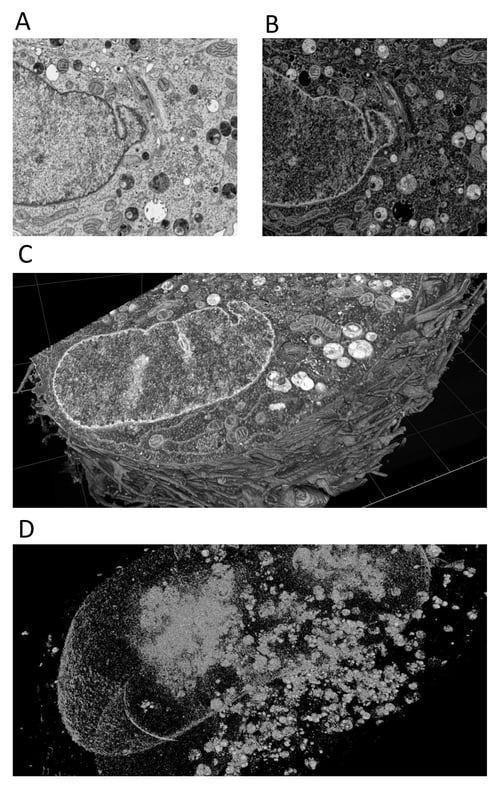
Figure 1. Overview of HeLa cell image set

Deep Neural Network Training

Figure_2

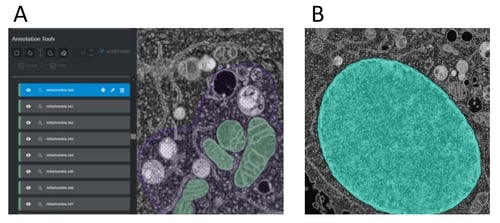
Figure 2. Generation of deep-learning models for organelles using the arivis AI toolkit on ZEISS arivis Cloud (formerly APEER)

The arivis AI toolkit on the cloud (formerly APEER) uses a U-net convolutional neural network for deep learning training using a representative sub-set of the images and hand-drawn segments (‘ground-truth’) that have been provided by the user. The number of segment types sets the number of model classes. To generate a ground truth class, the user paints instances of a class within the image. Here, mitochondria and the nucleus (as well as background) were painted within the cell as individual classes to be used for the training (Figure 2A-B).

Our (sparse) training sets comprised just 73 planes from the top of the volume to the bottom, spaced every 10 planes. We also trained on a minimal number of ground truth objects for each model. The nucleus model training used 53 objects (mostly full nucleus and some partial annotations) and the mitochondria model training used 1,133 objects (the majority were full mitochondria). Occasionally all the objects were painted in a plane, but most of the time only sub-portions of planes were painted.
Note, we also attempted to segment nuclear pores and proxy objects directly via deep learning. The former fails because representing the many orientations of pores via manual 2D painting is not feasible. For the latter, we trained a network by using 688 objects. The result was highly biased in producing objects with more completeness in the XY orientation, which makes for unreliable 3D processing and measurements (due to errors in XZ and YZ). Neural network models for the mitochondria and the nucleus were trained individually, resulting in two separate deep learning models (.CZANN). These models were then run on the entire image set and are applicable to any comparable image sets to predict all instances of each feature class.

Image Segmentation and Analysis

Trained neural networks were used in ZEISS arivis Pro (formerly Vision4D - Version 3.6 or higher required) pipelines to separately infer the two classes. After creating initial predictions, a segment feature filter was used to remove small (orphan) objects that were not truly part of mitochondria or the nucleus, followed by segment morphology operators to close off disjoined parts at the boundaries and remove small surface artifacts.
A series of ZEISS arivis Pro (formerly Vision4D) Analysis Pipelines were developed into several workflows aimed at producing relevant measurements from the mitochondrial and nuclear 3D objects. Also, we developed workflows to utilize the original nuclear mask to segment the well-defined low-density structures positioned under the nuclear pores inside the nucleus. We assume these structures are nuclear pore baskets with the underlying nucleoplasm. These Under-NPC-pockets were used as proxies to visualize and measure NPC distributions. We also derived 3D masks of nuclear pores for a clearer and more direct visualization and for future 3D deep learning.


ZEISS arivis Pro Analysis Pipeline Operations from our workflow and the example dataset are available on request: arivis.microscopy@zeiss.com 

Results

Segmentation and Measurements of Organelles

The first step in our cell-profiling workflow was to use the trained neural network models from the AI toolkit on ZEISS arivis Cloud (formerly APEER) to automate measurement of organelle volume. The objects produced by our AI-driven models for the mitochondria and nucleus required several improvements by both ZEISS arivis Pro (formerly Vision4D) Analysis Pipeline operations and manual proof-editing. The end products of the segmentation workflow are objects representing the volumes of mitochondria and the nucleus (Figure 3A). To compare the volume of these organelles with respect to the entire cell volume, we modeled the entire HeLa cell as a single object (Figure 3B) using the pixel classifier Machine Learning tool in ZEISS arivis Pro (formerly Vision4D). This machine learning classifier is based on a random forest algorithm and uses a few manually labeled pixels to classify all pixels within the image volume. We trained 2 classes, one for the cell and the other for the resin outside the cell. ZEISS arivis Pro (formerly Vision4D) computes the volume for all 3D Objects, which made it easy to calculate the percentage of total cell volume occupied by each organelle (Figure 3C). Our profiling was consistent with previous measurements, which have shown that mitochondrial volume is on average ~10% of the cytoplasm volume within HeLa cells (Posakony et al. 1977).

Figure_3

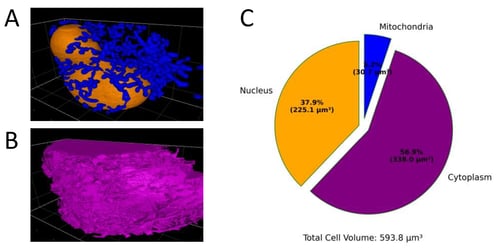
Figure 3. Segmentation results from a deep learning trained model can predict the percent of cell volume for organelles


Mitochondrial Characterization and Spatial Classification

Figure_4

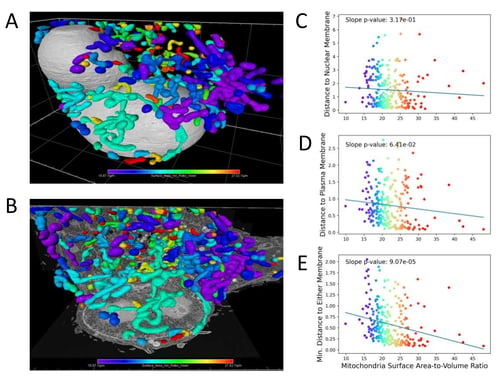
Figure 4. Mitochondrial surface area-to-volume ratios are negatively correlated with the distance to membranes.

Once we had segmented these organelles, we characterized their distribution within the cell. Specifically, we sought to visualize the distribution of the surface-to-volume ratios of the mitochondria. Color-coding the mitochondria based on this ratio highlights distinct distributions across the cell with respect to the nucleus (Figure 4A) and the cell surface (Figure 4B).
We then set up analysis pipelines in ZEISS arivis Pro (formerly Vision4D) to compute the distances of mitochondria to these cellular structures. Taking the distances of each mitochondrion’s center of geometry to the nuclear membrane (Figure 4C) or the plasma membrane (Figure 4D) did not result in significant correlations. However, when combining these two membranes to measure the minimum distance of each mitochondrial center of geometry to either membrane showed a significant correlation (Figure 4E).
These measurements highlight the ability of this approach to profile multiple distances between cell organelles and identify significant correlations. This method can be used with any cell structures that have been segmented and can measure distances between object surfaces or centers of geometry. Moreover, this approach can be scaled using the ZEISS arivis Hub (formerly VisionHub), so that multiple cell image sets can be analyzed in parallel and produce automated, high-quality profiles.

Initial 3D Segmentation of Nuclear Pore Complex Regions

The accuracy of our whole nucleus and nuclear membrane masks enabled us to use the volumetric rendering and clipping tools in ZEISS arivis Pro (formerly Vision4D) to explore the nucleus and nucleus-associated structures in 3D. Struck with how well we could see the nuclear pores in this volume, we wondered whether we could use ZEISS arivis Cloud and ZEISS arivid Pro (formerly APEER and Vision4D) to segment and measure them. However, within individual 2D planes the nuclear pores are difficult to recognize. The resolution of the image provides only a 100-150 voxels per pore (for reference, the total number of pixels within the image is greater than 1 billion) and the 3D structure of each pore is uniquely oriented to the curvature of the nuclear membrane.

Figure_5

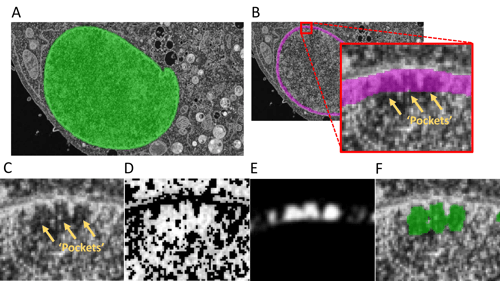
Figure 5. Identification of pocket objects under nuclear pores.

Thus, a direct, traditional 2D deep learning approach would require extremely tedious annotation of the NPCs in all possible orientations and would have to cover all variability in sample preparation and image acquisition. We decided to take advantage of the relatively large (approx. 400-2000 voxels) pockets under the pores, which we discovered were in a 1:1 stratified relationship with the pores throughout the nucleus and can be segmented in 3D. To generate 3D models of these distinct regions, we used our nuclear surface as a starting point for a series of 3D processing, segmentation, and object-modifying operations in ZEISS arivis Pro (formerly Vision4D). First, using the nucleus object (Figure 5A), an image mask was created to represent the volume just internal to the nuclear membrane where the low-density ‘pockets’ are located (Figure 5B). Several image processing steps were performed to emphasize the pockets within the images: image inversion and a 3D adaptive thresholding operation to remove lower pixel intensities outside the pockets (Figure 5C-D), and masking of the image based on the pocket layer followed by 3D particle enhancement of the pocket region (Figure 5E). Next, several operations were done in sequence to resolve the pockets: a watershed algorithm separates the pockets, a 3D region-growing operation to extend them beyond the borders of the arbitrary pocket layer, and a 3D distance operation to calculate the closest surface-to-surface distance of each pocket object to the nuclear membrane. Finally, a filtering operation was run to keep only the objects located closest to the nuclear membrane (Figure 5F).

Training a 3D-aware Neural Network for Nuclear Pores Segmentation

Figure_6_with_Distances_NEW

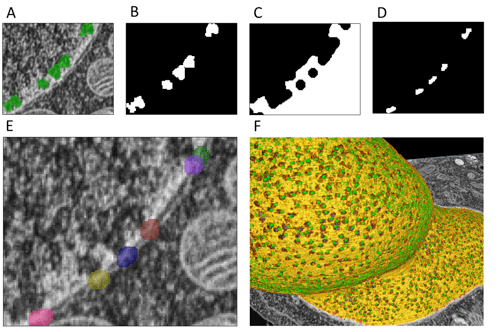
Figure 6. Nuclear pore complexes (NPCs) have variable density distribution across areas of the nucleus. Several processing steps were done to create masks of nuclear pores complexes from the pocket objects. Taking the pocket objects (A), a binary masked image was generated (B) followed by a closing operation of the pockets to nuclear membrane (C). Next, the nuclear membrane and pockets were used to mask the white space in shown in panel C (D). These objects were then dilated (E). Masking using these objects enhances the visualization of nuclear pore complexes (F).

Next, we set out to mask NPCs to create ground truths for a new 3D-aware deep learning neural network that will segment the NPCs directly. We were able to use the under-NPC- objects to derive objects representing the actual pores. Our initial strategy to segment the NPC particles required computation of a directional regional growth vector from the 3D geometric centroid of each under-NPC object towards the nuclear membrane, which would in high probability put us within the associated NPC and allow us to create an accurate mask. Instead, we discovered a way to achieve a roughly similar result without the need to leverage coding. Several masking and morphology operations were utilized to segment the volume between each pocket and the outer part of the nuclear membrane (Figure 6A-D). This volume was then dilated to cover the entire NPC (Figure 6E). Making a new image mask from these objects highlights the nuclear pore complexes visualized on Figure 6F. While not as precise a result as we would get from our original concept, this worked remarkably well and will allow for a non-manual creation of ground truth annotations for many thousands of pores for the subsequent deep learning training.

Once the segmentation of the NPCs was complete, the image stack and the corresponding NPC mask were rotated 30°, 60° and 90° on the X and Y axes and the resulting stacks were resampled to provide the 3D-aware augmented images of the 2D Deep learning algorithm on ZEISS arivis Cloud (formerly APEER) (Figure 7). 

Figure_7_ground-truth-3d-apeer_NEW

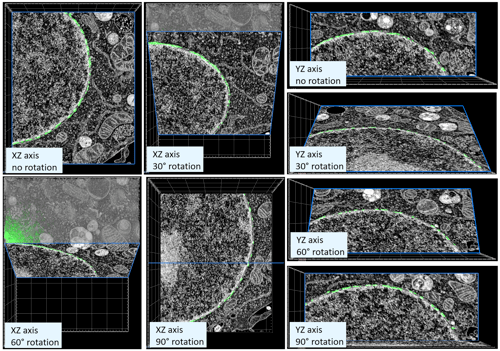
Figure 7. Preparation of the ground-truth dataset for the 3D-aware nuclear pore training on ZEISS arivis Cloud (formerly APEER). Nuclear pores were segmented using 3D morphological operators in ZEISS arivis Pro (formerly Vision4D) on a small representative image subset. Using a python script, the entire 3D stack was rotated on the two axes with linear interpolation. Each of the resulting stacks was resampled and every 5th plane was used for the 2D training of the deep learning model in the cloud.

Figure_8_3d-neural_network_NEW

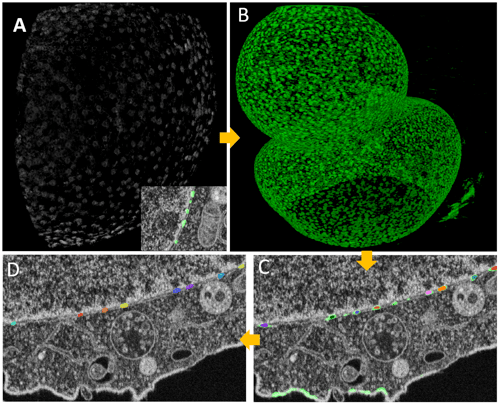
Figure 8. Training a 3D-aware neural network for nuclear pores segmentation. Several processing steps were done to create masks of nuclear pores complexes from the pocket objects. Taking the pocket objects (Figure 6), a binary masked image was generated followed by the 3D-aware resampling (Figure 7) in preparation for the deep learning model training. The resulting CZANN model was used to create the probability map in ZEISS arivis Pro (formerly Vision4D) with the Deep Learning Reconstruction operator (B). This 3D stack was filtered using the ‘Preserve bright particles’ operator and the objects were segmented using the watershed algorithm with a strict threshold (C). In the following step, the smaller subset of the particles was expanded by region-growing, while the largest particles were split and filtered with the segment feature filter (D)

We have applied the trained model to segment the nuclear pores on the entire nucleus to characterize their spatial distributions. Specifically, we utilized ZEISS arivis Pro (formerly Vision4D) Deep Learning reconstruction operator to create the probability map of the nuclear pore positions (Figure 8A-B). We then applied the morphological enhancement operator to filter some background. The NPCs segmentation was performed with the Watershed algorithm to separate the individual pores with the subsequent region-growing and a small morphological opening to smooth the surface of the pores and remove the small adjacent bright particles (Figure 8C-D). We estimate to have successfully segmented 80% of the total number of NPCs in the nucleus.

Distribution/Density Analysis of Nuclear Pores

We used these objects to view and quantify the 3D distribution of NPCs throughout the nuclear membrane. To accomplish this, we took two separate approaches. In the first approach, we used the ZEISS arivis Pro (formerly Vision4D) Distances operator. For each nuclear pore object, the average distance to the nearest 8 other nuclear pore objects was measured. Color-coding these objects according to this average distance to the nearest 8 objects was used to represent the density of pores across the nuclear membrane (Figure 9A). Since this measurement based on average distances gives a representation of nuclear pore densities, we wanted to compare this measure with other density measures. Therefore, as a second approach, we used the ZEISS arivis PRo (formerly Vision4D) python application program interface (API) to make a custom python operator integrated with the  software. Specifically, this python operator takes the 3D centroids of all the objects and uses the kernel density function within the scikit-learn python library to calculate their 3D densities. This kernel density function calculates a score based on the number of other objects in proximity, with a Gaussian smoothing of scores over a given radius.  This custom python operator then exported the resulting density scores as a numeric feature of these objects within the software. As above, we color-coded these objects according to their density score to permit visual assessment of the distribution of these scores (Figure 9B). The similarity between these two methods demonstrated that both the  Distance operator and the kernel density python script are capable of consistently identifying clusters of pores. 

To further characterize NPC distribution across the nuclear membrane, the nucleus was divided into two sections based on the nuclear invagination (Figure 9C). Taking the density scores of these two sections highlights that NPC density is higher within the smaller section of the nucleus with higher curvature (Figure 9D). In contrast, the larger section with a lower curvature degree has more low-density regions for nuclear pores. Overall, these distributions indicate that there is variation in our measured nuclear pore density over different portions of the nucleus. 

Figure_9_3d-density-distribution_NEW

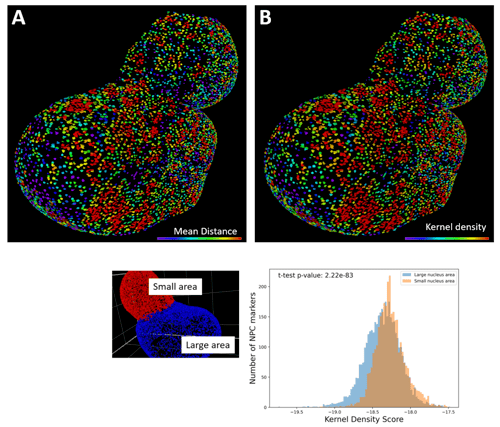
Figure 9. Nuclear pore complexes (NPCs) have variable density distribution across areas of the nucleus. A. The average distance of each nuclear pore object to the nearest eight nuclear pore objects was measured using the Distance operator in ZEISS arivis Pro (formerly Vision4D). The nuclear pore objects were then color-coded according to these distance measurements to give a representation of the density of nuclear pores across the nuclear membrane. B. As an alternative method of analyzing the distribution of the pore objects, the densities of nuclear pore complexes were determined by taking the 3D centroid of each NPC object and calculating a Gaussian kernel density, with a kernel radius of 0.1 µm, using a custom python script. C. The density distribution of NPCs is significantly different across separate areas of the nucleus. Sectioning the nucleus into two sections, a larger and a smaller section, based upon the nuclear cleavage furrow reveals significant differences in kernel density scores. D. A two-tailed t-test was performed to calculate the significance of differences between the kernel density scores in these two sections of the nucleus.

Summary and Future Direction

In this study, we present novel approaches to efficiently segment sub-cellular structures from FIB-SEM imaging data. Using ZEISS arivis Cloud (formerly APEER) to perform convolutional neural network training, along with the ZEISS arivis Pro (formerly  Vision4D) image analysis software, we were able to both expedite the creation of objects representing cellular structures (mitochondria and nuclei) and use these structures to develop analysis pipelines to identify additional smaller structures (nuclear pore regions). Moreover, we took advantage of the software's Python API to extend its analytical capabilities to measure the density of nuclear pore regions across the nucleus.

Our findings open new avenues for workflows utilizing a combination of traditional and deep learning algorithms, combined with prior biological knowledge. For instance, our approach of generating objects in the proximity of the NPCs can help identify nuclear pores in 3D regions, where the presence of a nuclear pore may be unclear from the plane-wise 2D analysis only. These 3D objects representing the nuclear pores can be used as ground truths for deep learning training of neural networks. Specifically, because these nuclear pore objects are 3D, varying XYZ planes of these 3D regions can be taken for the ground truths to train the network. We plan to augment these NPC annotations along numerous image axes, thereby multiplying the number of instances constituting the nuclear pore while preserving the structural pattern of this protein complex. This approach would not be possible using the ground truth annotations on individual 2D planes only.

Here we demonstrate a successful application of a complex workflow, which once established, can be scaled up for the automatic segmentation and quantitative analysis and profiling in ZEISS arivis Hub (formerly VisionHub).

References

Parlakgül, G., Arruda, A.P., Pang, S., Cagampan, E., Min, N., Güney, E., Lee, G.Y., Inouye, K., Hess, H.F., Xu, C.S. and Hotamışlıgil, G.S., 2022. Regulation of liver subcellular architecture controls metabolic homeostasis. Nature, 603(7902), pp.736-742.
Posakony, J.W., England, J.M. and Attardi, G., 1977. Mitochondrial growth and division during the cell cycle in HeLa cells. The Journal of cell biology, 74(2), pp.468-491.

Original datasets imaged with a ZEISS FIB-SEM instrument and kindly provided by Anna Steyer and Yannick Schwab, EMBL Heidelberg, Germany. Datasets first published in: Hennies J, Lleti JMS, Schieber NL, Templin RM, Steyer AM, Schwab Y. AMST: Alignment to Median Smoothed Template for Focused Ion Beam Scanning Electron Microscopy Image Stacks. Sci Rep. 2020 Feb 6;10(1):2004. doi: 10.1038/s41598-020-58736-7.

The original datasets used for method development are available in the EMPIAR repository. A resized version of the dataset (1.7 GB) for more convenient download and computation that also includes a detailed workflow with analysis pipeline is available on request: info@arivis.com 

DATA PROTECTION AND SECURITY

How Data is Handled in the Cloud

Learn about workflows and solutions available on ZEISS arivis Cloud (formerly APEER):

Learn more about diverse image analysis workflows and solutions ->