arivis Scientific Image Analysis

Organoid Volume Quantification

Contact us


Organoid Volume Quantification


Color B/W

Before and After Analysis

Interact with the image to see before and after.

Adjust the slider to view the 'before and after' comparison.

Solution Description

Automated analysis of organoid growth and differentiation is important for toxicity assays, drug screening and quality control protocols.

This solution can be used to quantify the volume of organoids and their lumens if applicable. As a first step, the organoid area and the lumen area are segmented using a trained deep learning network. This segmentation is then applied to z-stack images of many organoids gathered from multi-well plates.

63936ab84891cf1f059f0d59_organoid_3_3D_image_landscape

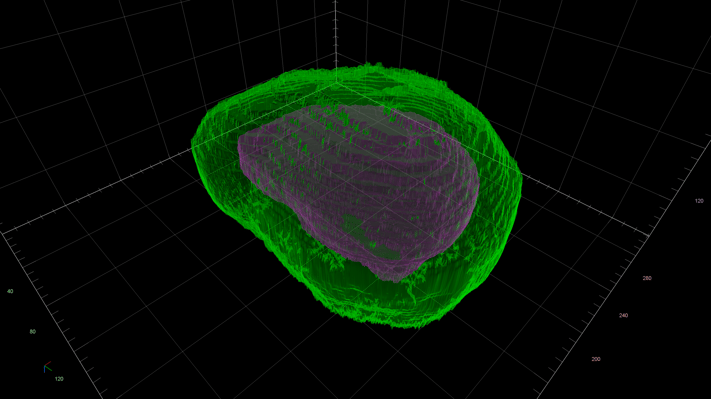
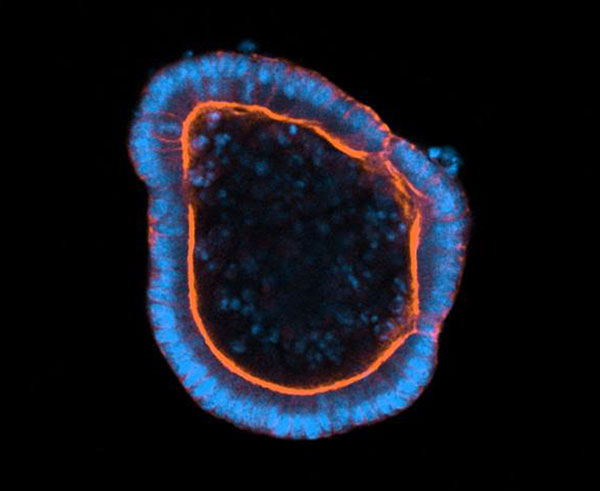
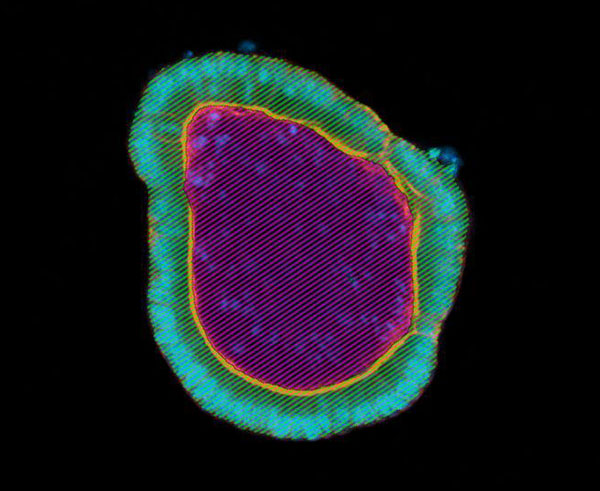
Figure 1: 3D Visualization of an organoid (green) and lumen (magenta)

For each organoid, 3D objects are generated that are used to quantify the organoid and lumen volumes. Finally, the measurements are presented as tables and interactive plots making it easy to understand and interpret the results.


638613edb497bceab75749b3_organoid_4_graph

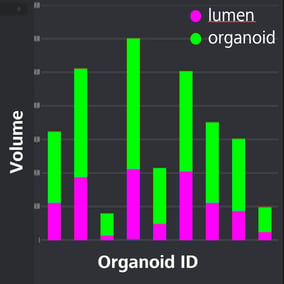
Figure 2: Volume of whole organoids and lumen plotted for a selection of organoids. Based on total volume, organoid growth was assessed. Based on the ratio of lumen per organoid, the differentiation of each individual organoid was assessed.

Keywords:
Deep learning, arivis Cloud, arivis Vision4D, Celldiscoverer7, organoid, growth, differentiation
 
Image Source:
Example sample shown here was kindly provided by M. Lutholf. Imaging was performed by Frank Vogler, ZEISS Demo Center Oberkochen.