arivis Scientific Image Analysis


Phase Fraction Analysis in duplex stainless steels

Solution Description

Austenitic stainless steels are tough, relatively easy to weld and generally resistant to corrosion (hence their use in many domestic applications) but can be susceptible to stress-corrosion cracking in certain environments. Ferritic stainless steels are more resistant to stress-corrosion cracking but are comparatively brittle versus austenitic stainless steels and are harder to weld. Duplex stainless steels have carefully selected compositions which have high levels of chromium and other alloying elements that lead to a microstructure containing approximately equal amounts of ferrite and austenite. The synergy of the two disparate phases allows the structure to overcome several issues of the individual phases – the steel is relatively weldable but also resistant to stress-corrosion cracking. Duplex stainless steels are generally used for specific service environments, where corrosion resistance, mechanical strength and weldability are all needed.

The ratio of ferrite to austenite is affected by the composition but also by the thermal history. Welded regions and heat affected zones may have different ratios of austenite to ferrite and thus different local properties. To understand/predict the steel behavior a metallurgist must determine the austenite/ferrite ratio in these regions. Metallographic preparation of duplex stainless steels is relatively straight forward, to allow the austenite and ferrite to be visualized. However, it is difficult to etch the duplex stainless steel in a way that lends itself to automated analysis by thresholding, particularly where the austenite grain size varies dramatically.

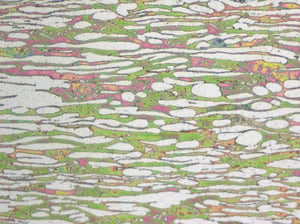
AdvSeg_fig2a-1AdvSeg_fig2b-1AdvSeg_fig2c-1

Figure 1 (A) Cross-section of duplex stainless steel (B) The same cross-section after segmented by thresholding on RGB values (C) After segmentation using machine learning in ZEISS ZEN Intellesis (right). Sample courtesy of TWI Ltd

Figure 1 shows an example micrograph of unwelded duplex stainless steel after color etching. Automated segregation of white austenite from brightly colored ferrite by thresholding based on RGB values is successful for the larger grains of austenite, but struggles on the smaller grains of austenite due to etching effects and color bleed from surrounding ferrite. Using machine learning, a user can successfully segregate the austenite from ferrite, even the smaller grains. There is always a degree of ambiguity determining the exact position of borders between one region and another in any image analysis operation, but this ensures that smaller regions are not missed. When measured using traditional thresholding, this field of view has 46.9% austenite, but when measured using segmentation by machine learning, this increases to 51.2% austenite.