Coatings and surface layers are used in a variety of industries – cosmetic, functional, protective or even just formed as a by-product. Examples include paint, galvanization, thermal spray coatings, corrosion scale, epoxy resins, physical vapor deposition, chemical vapor deposition and catalytic layers.
The thickness of the coating(s) and individual coating layers will affect the lifetime and performance. As such, measurement of the thickness of the coating is a key parameter – not just average thickness but minimum, maximum and thickness distribution over a known length. This can be done manually or automatically, and there are a number of Standards for coating measurement (e.g. ASTM B487-85[7]) depending on the specific application.
In some micrographs, coatings are clearly differentiable from their surroundings, with a color or greyscale value range that does not overlap with that of the substrate or mounting resin. Standard thresholding and image processing applications are sufficient to segregate the coating in these cases.
More often, the differences between layer(s) and substrate may be clear to the human eye but hard to automatically analyse. Figure 5 shows three examples. For the galvanized steel, the greyscale values of the coating match those of the resin in several locations. This makes subsequent image processing difficult.
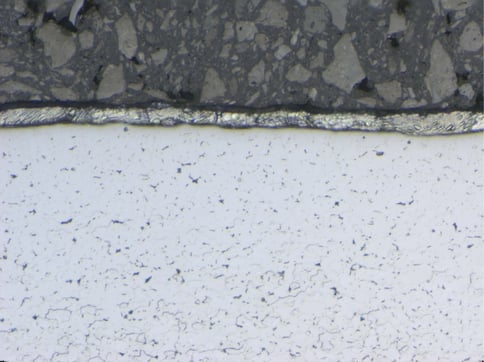
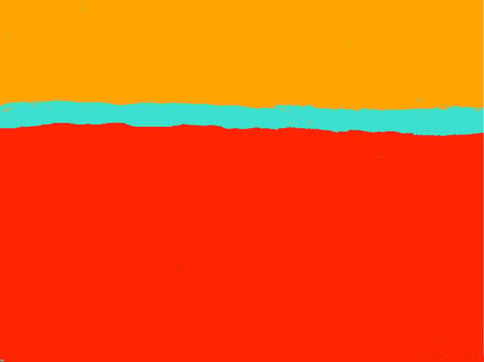
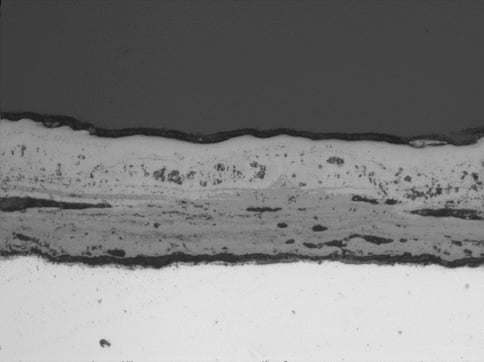
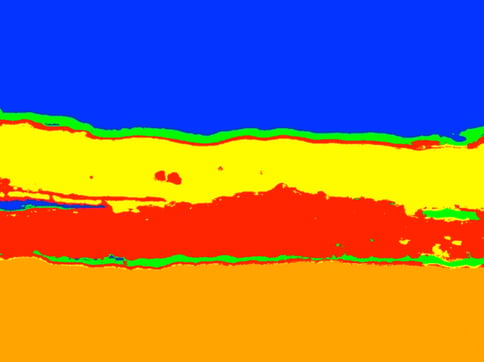
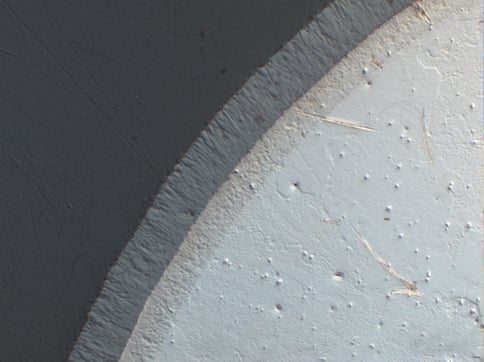
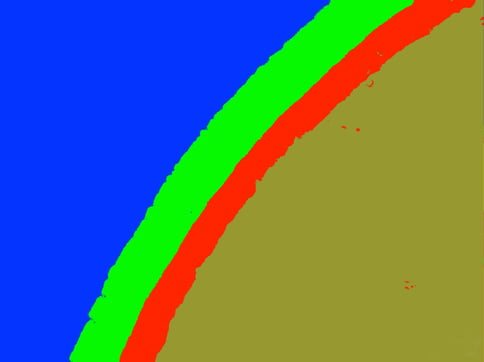
Figure 5 ZEISS ZEN Intellesis segmentation of coating cross-sections. Each color on the segmented image represents a different coating layer. (Top) Galvanised steel – bright field. (Middle) High temperature corrosion scale on 9% chromium steel – bright field. Sample courtesy of TWI Ltd (Bottom) Thermal spray coating, taken using C-DIC contrast The high temperature corrosion scale can be segregated from the substrate, but individual layers within the scale are more difficult, particularly as the pores in one phase can match the greyscale value of the other.
For the ceramic sample, two separate challenges were present – the layer closest to the substrate differs from it primarily in terms of texture rather than greyscale values, and there are several scratches on the sample crossing boundaries between layers.
In all cases, after sufficient training ZEISS ZEN Intellesis was able to segregate the layers for subsequent quantitative measurement. This was true even where the sample was scratched or had other metallographic preparation artifacts.
