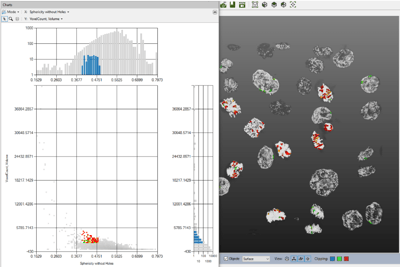
The new Chart in Object Table allows users to graph one or two features from either all or selected objects in the table. Using the ‘object selection’ and the Color tool from Object Table we can find even more sophisticated usage with Chart tool.
Specifically, we can color code the objects based a feature, and use that to highly a particular subject of objects in our image.
This helps users to understand the object-object interactions, and helps users to tell a more complete story about their image. Here are some examples and ideas of how you can use tools in ZEISS arivis Pro (formerly Vision4D - Version 3.0 was used) Object Table to tell others about your remarkable data.
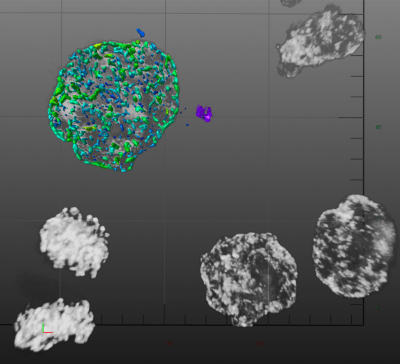
Here is a close up, showing a color coded seleted objects overlaid on top of a greyscale rendering of original data. This is an artifical situation which could be used to really point the users interest towards a particular feature in the data.
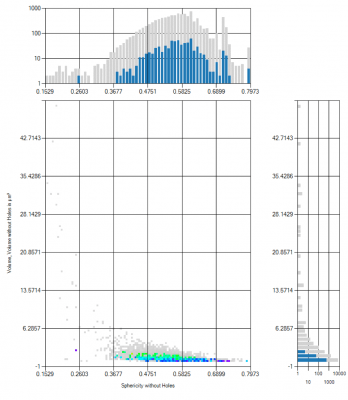
This helps you to understand if those select objects are similar or different to the overall population of objects that you have found.
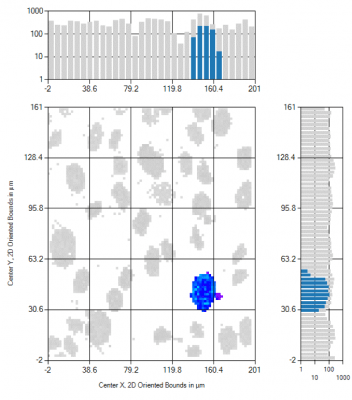
Using the same axis, we can now select a different subset of object, to look for their distribution, and see if those outliers are in a single object, or evenly distributed in the population. This is an extremely powerful investigation tool which allows users to quickly find insight in the interaction of objects in their data.
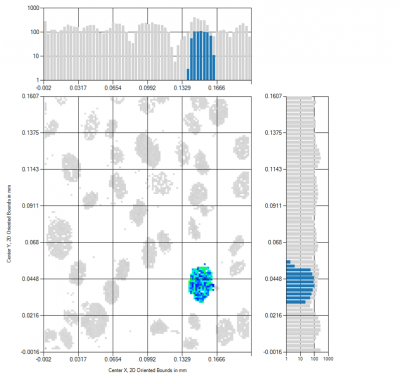
Only ZEISS arivis Pro (formerly Vision4D -ver. 3.0 was used) can offer the power to fully understand the dynamic relationships in your data using the power of chart selection and on screen interactive 3D visualization