arivis Scientific Image Analysis

Image Analysis Workflow for Mining EM Images

Request a Trial
USE CASE

The Challenge

Electron microscopy (EM) image segmentation and analysis is often complex and difficult. Thus classical image analysis approaches (intensity threshold, spatial filtering, and object separation) and machine learning approaches are not without pitfalls and inefficiencies that do not befall a human expert.

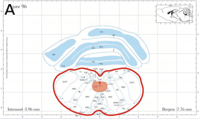
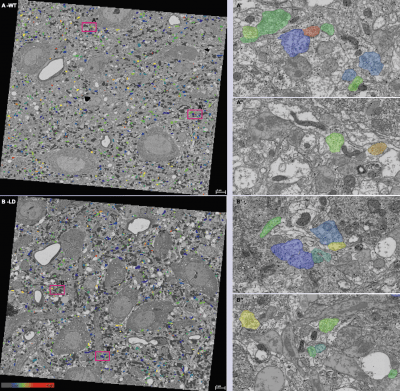
Researchers at the George Washington University Nanofabrication and Imaging Center devised an innovative approach to produce large area, high-resolution SEM images in quality and resolution comparable to biological TEM.  For a first application, they sought to investigate alterations of the inhibitory neurotransmitter GABA (γ-aminobutyric acid) in the hypoglossal nucleus (diagram of Coronal IA brain section showing the location, A) of an animal model of 22q11.2 deletion syndrome.

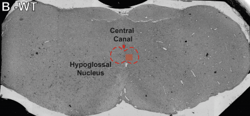
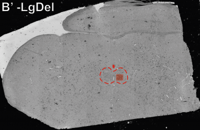
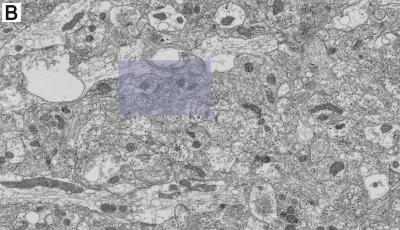
Although they were able to label GABA with remarkable contrast and consistency across massive sections of tissue (full brain slices are shown in B and C with the high-resolution data acquisition sites indicated in red), they required and sought a data structure and computational interface that would help them not only get accurate counts of gold particles but also probe GABA alterations specifically in the synaptic terminals.

gw_txt_4cp_pos_0-min

Image courtesy: C. Clarkson-Paredes1, C.A. Brantner1, C. Zugates2, M. Rust3, *A.S. Poptratiloff1,
1Nanofabrication and Imaging Center (GWNIC), The George Washington University, Washington, DC; 2Carl Zeiss Microscopy Software Center Rostock GmbH. (formerly arivis Inc, Washington, DC; and arivis AG, Rostock, Germany)
 

Download Poster


Processing Enabling Rigorous GABA-Post-Embedding Immunogold Quantification11_0-min Processing Enabling Rigorous GABA-Post-Embedding Immunogold Quantification12-min

Processing Enabling Rigorous GABA-Post-Embedding Immunogold Quantification13-min

They required their computational platform to:

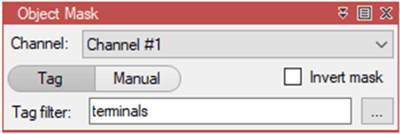
•    Enable them to expertly and collaboratively outline all the synaptic terminals
•    Automatically (algorithmically) count all the gold particles
•    Associate individual gold particles with specific synapses
•    Handle their ever-growing data sets, i.e., be completely scalable in terms of image size, algorithmic computation, and visualization of results

Solution provided by ZEISS arivis Hub (formerly VisionHub)

By converting their *.RAW imaging system data directly to the arivis Scalable Image Storage (*.SIS) format, we could give them instant access and interactivity to any portion of the data (regardless of image size) in any arivis software tool. As they plan to produce ever-larger images both in span, volume, and density of content, the SIS format and its arivis interfaces are ideal for providing smooth systematic exploration. These data were then directly uploaded to an arivis WebView server and made available to these experts or a team of expert collaborators. Thus we crowd-sourced expert segmentation of synaptic terminals and mitochondria.

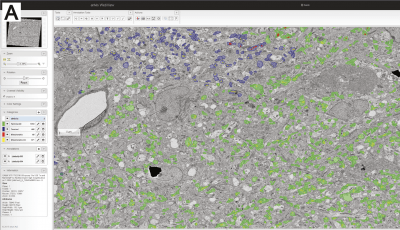
In a standard web browser interface (shown in A), each expert painted all the synaptic boutons present within the large area of the hypoglossal nuclei disregarding synapse morphology (i.e., vesicle size, shape, active zone morphology). Mitochondria within synaptic terminals were also outlined (and tagged) as separate annotations. Each expert could distinguish their own annotations versus other collaborators.

At various times, the Web-hosted annotations were conveniently transferred via web browser and associated with local copies of the *.SIS data sets.  This enabled concomitant construction and optimization of an analysis strategy that could report the density of GABA per synaptic terminal.  In the end, this was applied to the fully annotated images.

Learn more about ZEISS arivis Hub ->


Processing Enabling Rigorous GABA-Post-Embedding Immunogold Quantification3-min


BENEFITS

The Advantage of Using Future-orientated Collaboration Tools and Cross-platform based Software Solutions

Science research requirements vary for every experiment. There are a few things that most imaging scientists need and are expected in a future-oriented solution. The arivis tools all leverage the SIS format, permit experts to work directly on raw data and control every aspect of the processing/analysis, and adapt to situations/interfaces that researchers need. Being able to go from imaging systems (in this case SEM) to computers (powerful workstations or standard laptops) to the World Wide Web seamlessly, without the need of coding or IT support, enabled this project to proceed with the utmost efficiency. The whole project was completed by the stakeholders in the science.

Overview of ZEISS arivis Desktop and VR integrated Collaborative Workflow

STEP 1

Segmentation of Presynaptic Terminals and Mitochondria (Web browser, Collaborative)

image analysis image mining WF1


Images and object information were Web-hosted and available to all collaborators via a standard web browser interface. Once EM data were uploaded to the web server, and each user setup their credentials and permissions, they could add information to any portion of the image and tag their annotation objects according to type (in this case, Terminals and Mitochondria).
STEP 2:

Development of an Optimized GABA-counting Algorithm (Laptop, Individual)

In parallel to web-based segmentation, an analysis strategy was developed and optimized with ZEISS arivis Pro (formerly Vision4D), which is a feature-rich, multithreaded, and interactive image processing platform enabling rapid prototyping of powerful and accurate processing. No coding was needed, as all operations are integrated and parameterized via a logical GUI. The software provides the requisite visual and quantitative feedback for efficient algorithm optimization quickly and on any hardware. Algorithm development was done on a standard laptop using arivis Analysis Pipeline.

image analysis image mining WF2


STEP 3:

Computation of Terminal GABA-density, Custom Coloring, and Examination of Results (Workstations and Laptops, Collaborative)

image analysis image mining WF3


The complete sets of synaptic terminals and mitochondria and the optimized analysis pipelines were easily downloaded onto a powerful workstation. We then speedily completed the computation of GABA-density. Once automatic segmentation and association (to each synaptic terminal) of every gold particle was complete, the results could be viewed on the EM images by everyone. Various custom features, color tables, and scaling were then collaboratively explored for the final visual representation of GABA-density.

Using arivis Analysis Pipeline

Building reliable analysis algorithms requires careful study of raw data and (importantly) a feedback-driven approach to optimize results. Before attempting to build the analysis pipeline, we carefully investigated the images from the point of view of processing/analysis.

Panel B below shows a portion of one of the large format EM images. Part of this view was selected to illustrate the analysis processing that follows and is highlighted by the shaded purple box. With the acquisition parameters that were used to produce the image (2kV, 400pAmp landing electron beam and elastic scattering detection with CBS), there is clear definition of the gold particles over the counterstain Uranium signal.

Processing Enabling Rigorous GABA-Post-Embedding Immunogold Quantification4-min


Processing Enabling Rigorous GABA-Post-Embedding Immunogold Quantification5-min

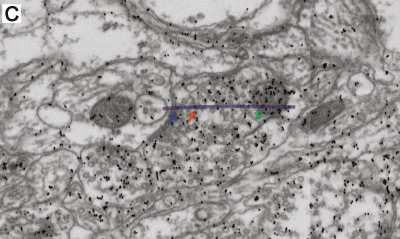
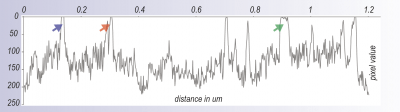
The box in region in B (expanded in C) covers two synaptic boutons establishing an active zone on a dendrite. The purple line (shown in C) was used to generate a pixel intensity scan (graph below). The arrows indicate the signal deriving from each gold particle. In C and the graph, the intensity differential between the uranyl counterstain and the gold particles is quite obvious.

The line scan, plotted against pixel brightness, clearly illustrates that the 1.6 nm pixel resolution of this acquisition is sufficient to resolve the signal from a single gold particle (blue arrow) by applying single intensity threshold. This resolution is also supportive for intensity threshold separation of gold particles at a close proximity to each other (red arrow), but not sufficient to resolve clusters (green arrow). Therefore, additional application of a morphology-based operation is needed in the processing strategy.

Processing Enabling Rigorous GABA-Post-Embedding Immunogold Quantification9-min


screenshot1-min


Although the signal from GABA-coding nanoparticles is naturally strongest in the SEM images, the investigators inverted the images in order to parallel data achieved on TEM. However, such an inversion is not entirely logical from the image processing perspective (often it’s convenient to segment objects that are positively labeled in relatively darker background rather than vice versa). Therefore as an initial processing step in the ZEISS arivis Pro (formerly Vision4D) analysis pipeline, we applied an inverse filter so that the gold particles present the brightest elements of the image. This is then followed by several processing steps (explained below) in order to isolate the synaptic boutons from the rest of the image data set.

Processing Enabling Rigorous GABA-Post-Embedding Immunogold Quantification17 (1)-min


Masking Synaptic Boutons (D left panel):

The synaptic boutons (that had been collaboratively segmented via the web) were used to mask the image pixels so that only pixels corresponding to the interior of synaptic boutons are further processed in the subsequent steps.

screenshot2-min


Inverse Masking of Mitochondria (D right panel):

screenshot3


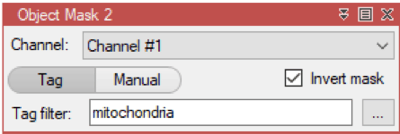
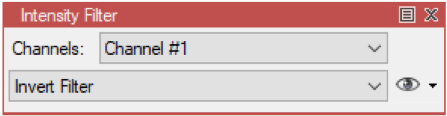
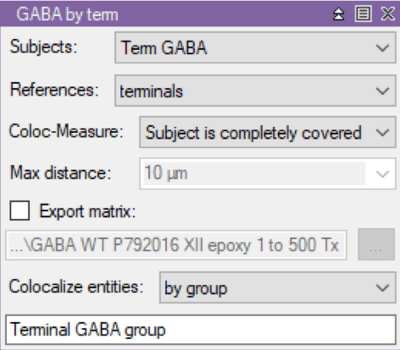
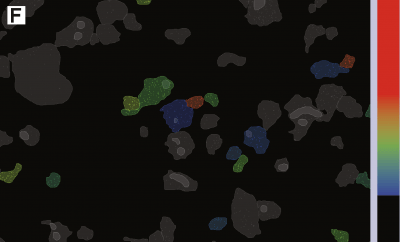
The GABA mitochondrial pool most likely represents GABA degradation rather than the synaptic transmitter fraction. Therefore, the mitochondria objects (that were collaboratively segmented via the web) were used to inverse mask the image pixels that came from-the synaptic boutons. This approach eliminates the pixels corresponding to mitochondria so that only pixels corresponding to synaptic boutons are processed by subsequent steps.

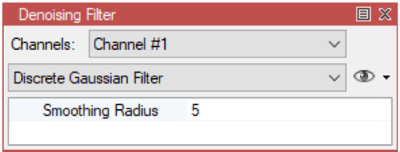
The next steps of the image processing were designed to isolate the signal from the gold particles encoding GABA.

Intensity Thresholding to Isolate GABA Encoding Gold Particles Signal (E left panel):

We found that the contrast highlighting GABA-coding gold particles (see above, C) was remarkably consistent throughout the entire large format images. Therefore a single global intensity threshold was capable to isolate the signal from the gold particles from the rest of the structural information. Pixels above the threshold value were passed to subsequent steps.

Processing Enabling Rigorous GABA-Post-Embedding Immunogold Quantification8-min


Gaussian Blur (not shown):

screenshot4-min


In our preliminary algorithm optimization, we found that a subtle blur at this step increases the yield of truthful GABA dots and enhances the seed-based watershed segmentation later in the pipeline. This is well expected since the image data consist of variable white noise deriving from the gain applied to the detector and relatively short pixel integration times.

Morphology to Enhance Bright Objects (after Gaussian Blur, E Middle Panel):

This morphology operation computes the difference between the input image and iterative erosion/dilation by a structuring element. Elements greater than the radius of the element passed this filter. This is a particularly effective strategy for extracting bright small details from an image, in this case the core of each GABA gold particle being represented by a small bright core. We found that in combination with the previous Gaussian blur we achieve a better yield of truthful dots.

Seed-based Watershed (E right panel):

This final image processing step applies automatic seed-finding and a watershed algorithm. The operation uses the Gaussian scale to find the object seeds and a watershed algorithm to identify object boundaries. This step was necessary, since not all gold particles can be resolved by intensity threshold alone (see graph and C above, green arrow).

Setting up the Segementation Operator:

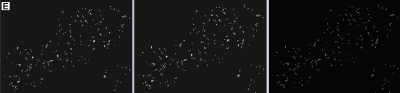
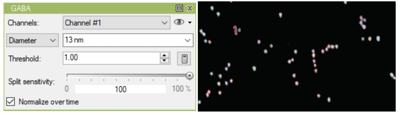
The operation chosen to outline all the gold particles is called “Blob-Finder” in ZEISS arivis Pro (formerly  Vision4D) Analysis Panel. It operates as a 3D seed-based watershed that isolates blobs in volumes for 3D images; and it works in 2D in a similar way, isolating roundish objects.

We set and optimized the Diameter parameter empirically by using the preview tool in the operator and by running test segmentations on various regions of interest. This was easy and efficient. A Threshold value was not important in this case because a Thresholding was already performed at the pixel level earlier in our routine. Split Sensitivity was set to the max to divide all touching gold particles into individuals.

Finally, to maintain an understandable data structure, the operation was renamed (right-click on the operator to access the renaming function) to GABA. This way every object found by this segmentation routine was named and tagged “GABA” in the database.

screenshot5


screenshot6


Once the gold particles were segmented, the objects could be further filtered to enrich for the truthful pixels corresponding to gold particles and ultimately to associate gold particles with their parent synaptic boutons. All filters and associations are captured by the software. Any feature or tag in this database can be used as a basis for sorting, for computation of custom object features, and can be visualized with colors and gradients.
The final product of the pipeline was an object database mapping to the original image pixel locations (See F below). Various morphometric parameters are visualized at their original image location, while maintaining the positional relation of an object to the overall population. In this case, the original pixels were hidden and the image displays the terminal synaptic bouton-objects with mitochondria excluded. The color coding is based on the terminal’s concentration of GABA-encoding gold particles. Since the distribution is skewed, the red in the color table has also been skewed proportionally to highlight the fewer strongly labeled synaptic boutons.

Processing Enabling Rigorous GABA-Post-Embedding Immunogold Quantification10-min


Result

Processing Enabling Rigorous GABA-Post-Embedding Immunogold Quantification15_0-min

Color coding GABA terminal density distribution in the mouse hypoglossal nucleus: A (WT) and B (LgDel), high magnification (80,000x/SFV) tile stitched SEM images of the XIIN (highlighted previously above) showing color coding distribution of all synaptic terminals where 10 nm-gold particles were segmented. Notice the shift to the blue (less dense) side in the LgDel animals, representing a decrease in the GABA content of presynaptic terminal in the XIIN versus WT animals.

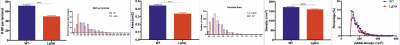
Quantitative analysis of GABA content in presynaptic terminals from the hypoglossal nucleus of LgDel animals using post-embedding immunogold labeling and SEM:

A) The number of GABA-GP significantly diminished in the LgDel animals while their distribution shifted to the left side showing the largest peak at 20 GP per terminal in comparison with the WT group where peak moves to 40 GP per terminal.
B) Also, the presynaptic terminals area significantly decreased in LgDel group versus WT animals, supporting the idea of smaller terminals in LgDel model, the distribution of the areas in this model was higher for the smallest values, even when the number of terminals analyzed between groups (same area size) was similar.
C) The density of GABA GP/distribution in the XIIN presynaptic terminals was lower in the LgDel group, which strongly indicates that the inhibitory neurotransmission of this nucleus in this animal model is altered due to a decrease in GABA content in presynaptic terminals. (****Mann-Whitney test- two tailed p<0.0001).

Source Data Specifications

Sample preparation and imaging were done by Cheryl Clarkson-Paredes, Chris Brantner, and Anastas Popratiloff at the George Washington University Nanofabrication and Imaging Center.  These data were presented in stages at the Microscopy and Microanalysis and the Society for Neuroscience research conferences in 2018.

Tissue sections were first mounted on silicon wafers and then processed for post-embedding immunogold following conventional protocol. They pre-treated the sections for epoxy resin etching with 1% sodium metaperiodate by 20 min, then sections were pre-blocked with 1% NGS for 10 min and then incubated with a rabbit anti-GABA (A2052 Sigma-Aldrich) in TBST containing 1% NGS for 3 hr. at 37oC. Primary antibody was recognized with a goat anti-Rabbit IgG gold-conjugated, 10 nm diameter secondary antibody (15726-1 Ted Pella) in TBST containing 1% NGS and polyethylene glycol (5mg/ml) for 1 hour at 37oC.

The uses a Helios NanoLab 660 SEM (Thermo Fisher, FEI) with concentric backscattering detector in immersion mode. Individual images were taken at HFV of 6.38um (3072x2048 px). Gold particles encoding GABA are readily distinguishable, and appear round.  To increase the sampling of GABA positive and negative synaptic terminals, they stitched large areas (119x102 um, 70645x60616 px) of the hypoglossal nucleus, producing massive data sets.