arivis Scientific Image Analysis

Cell Confluency

Contact us


Cell Confluency


Color B/W Fullscreen

Before and After Analysis

Interact with the image to see before and after.

Adjust the slider to view the 'before and after' comparison.

Solution Description

Quantifying cell growth over time is a central application in biology. The cell confluency solution enables you to quantify the percentage of area covered by cells in phase contract images. It supports time series as well as scenes for multi-well samples. The output is a heatmap that shows the percentage of area covered by cells for each well and time point (if applicable). The respective deep-learning model is trained on phase contrast images as acquired, for example, by a Celldiscoverer 7 microscope.

63860fd08876016b1e171d12_Cellconfluency_3_graph

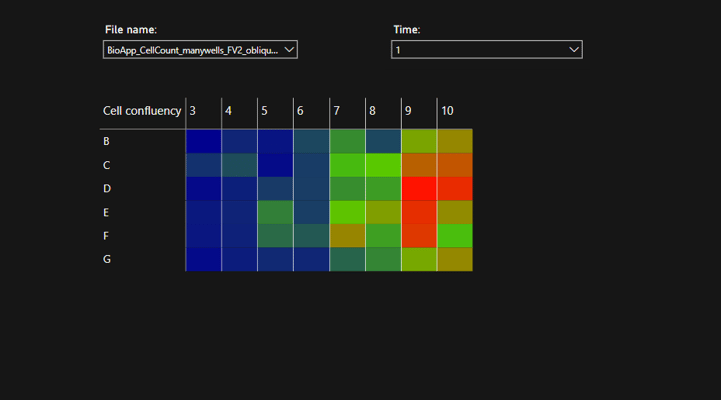
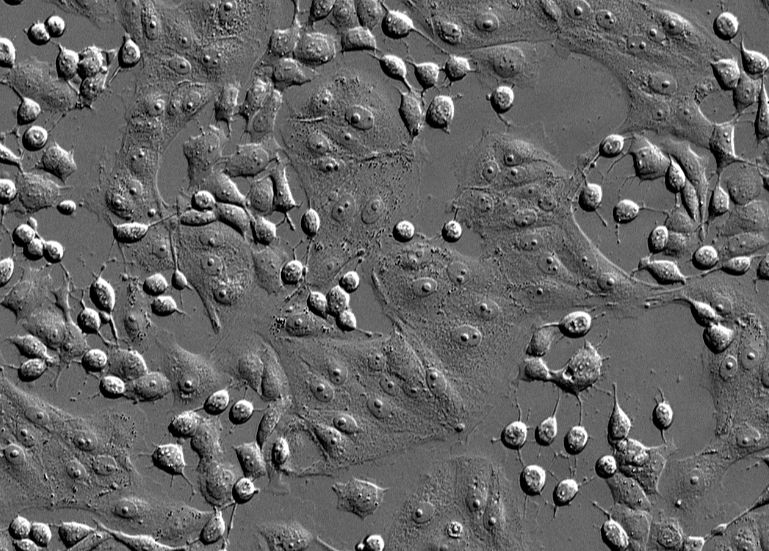
Figure 1: Cell confluency (percentage of area covered by cells) plotted as a heat map and over time based on a multi-well sample

(red: high confluency, blue: low confluency).

Keywords:
Deep learning, arivis Cloud, cells, area, phasecontrast, Celldiscoverer 7, cell confluency