arivis Scientific Image Analysis

Compartmentalization of Chromatin

Contact us
CASE STUDY

3D Distribution and Compartmentalization of Chromatin in the Nucleus

Institute: Weizmann Institute of Science, Rehovot, Israel 

Lab: Department of Molecular Genetics, Department of Chemical and Biological Physics, Department of Immunology 

Authors: Daria Amiad-Pavlov, Dana Lorber, Gaurav Bajpai, Adriana Reuveny, Francesco Roncato, Ronen Alon, Samuel Safran, Talila Volk 

Infrastructure for imaging and image analysis was provided by "The de Picciotto Cancer Cell Observatory In Memory of Wolfgang and Ruth Lesser" Life Sciences Core Facilities. 


Researchers at the Weizmann Institute of Science are using live 3D imaging and ZEISS arivis Pro (formerly Vision4D) software to gain a better understanding of how native chromatin is distributed in the nucleus.
Live imaging can sometimes generate large image datasets. ZEISS arivis Pro (formerly Vision4D) is specifically designed to allow users to easily view and render these images without a large overhead of hardware. In addition to analysis pipelines, users can also create and import their own python scripts that work directly from within the ZEISS arivis Pro (formerly Vision4D) software for their own tailored analysis needs.

Matryoshka Analysis to Measure Distribution

Presently, it is thought that native chromatin is distributed uniformly throughout the nucleus.  However, their research has in fact shown that native chromatin (both active and nonactive) is located near the nuclear envelope.   

In this study, researchers used ZEISS arivis Pro (formerly Vision4D) and a Matryoshka (Russian doll) script to generate concentric spheric volumes that allowed for the measurement of chromatin distribution in live 3D cell volumes. 

Video courtesy: Amiad Pavlov et al.  3D view of a live control nucleus showing chromatin at the periphery. The segmented nucleus is divided into 10 concentric 3D radial shells for quantification of radial chromatin distribution.

Chromatin in the Periphery of the Nucleus

3D matriyoshka analysis


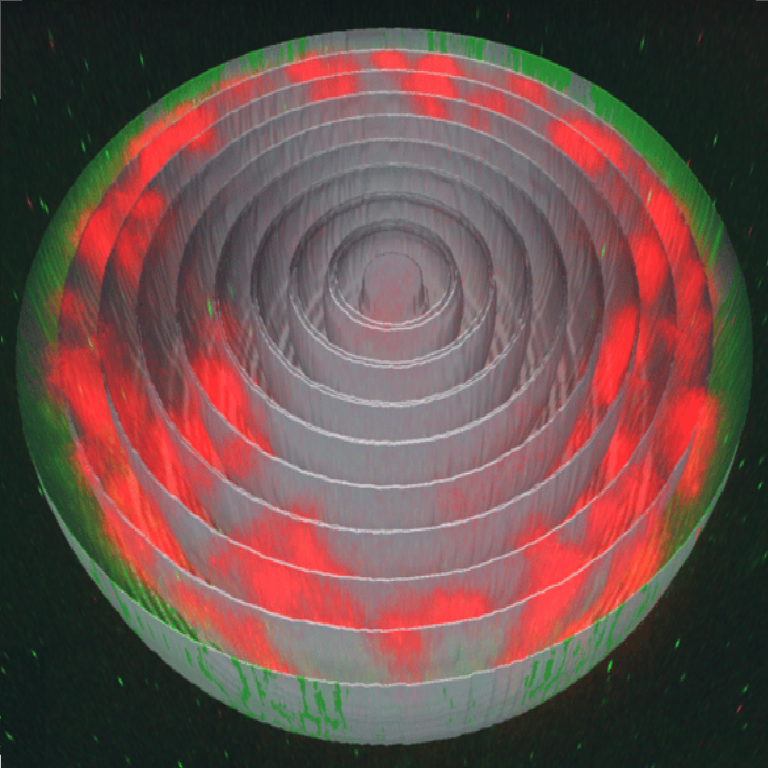
3D visualization of the live muscle nuclei revealed a peripheral distribution of the chromatin, with a substantial region in the interior of the nucleus that was devoid of chromatin.  The nuclear envelope was labeled with nesprin/klar–GFP (green fluorescent protein) and chromatin was labelled by expression of His2B-mRFP (histone H2B–red fluorescent protein). 

To quantify chromatin distribution along the radial direction, the researchers segmented each nucleus in 3D and divided into 10 concentric shells.  Chromatin density for each shell was calculated from the sum of His2B-mRFP fluorescence intensity, divided by the shell volume.

Image courtesy: Amiad Pavlov et al.  3D view of a single live muscle nucleus cut through the middle. Chromatin is labeled with His2B-mRFP (red) and nuclear envelope with nesprin/klar-GFP (green). For quantification of radial chromatin distribution, the segmented nucleus is divided into 10 concentric 3D radial shells (gray). 

Lamin C Overexpression Causes Chromatin to Collapse Towards the Center of the Nucleus

The nuclear lamina, a thick meshwork of intermediate filaments associated with the inner nuclear membrane, is a major regulator of chromatin architecture, as it tethers mostly dense heterochromatin at specific sequences termed lamina-associated domains (LADs).
LADs are specifically sensitive to the levels of lamin A/C at the nuclear lamina. It was found that peripheral chromatin architecture was sensitive to overexpression (OE) of lamin A/C resulting in chromatin condensation toward the centre of the nucleus.

The study presented the first 3D analysis of global chromatin organization of fully differentiated nuclei within the preserved physiological environment of a live, intact organism.  ZEISS arivis Pro (formerly Vision4D) allowed the researchers to create analysis protocols that quantify chromatin contained within the nuclear envelope.
Use of a bespoke Matryoshka script for quantifying the distribution of the chromatin was possible due to the versatility of the software in allowing users to apply their own scripts to their datasets directly in  ZEISS arivis Pro (formerly Vision4D).

Nucleus, overexpressing lamin C

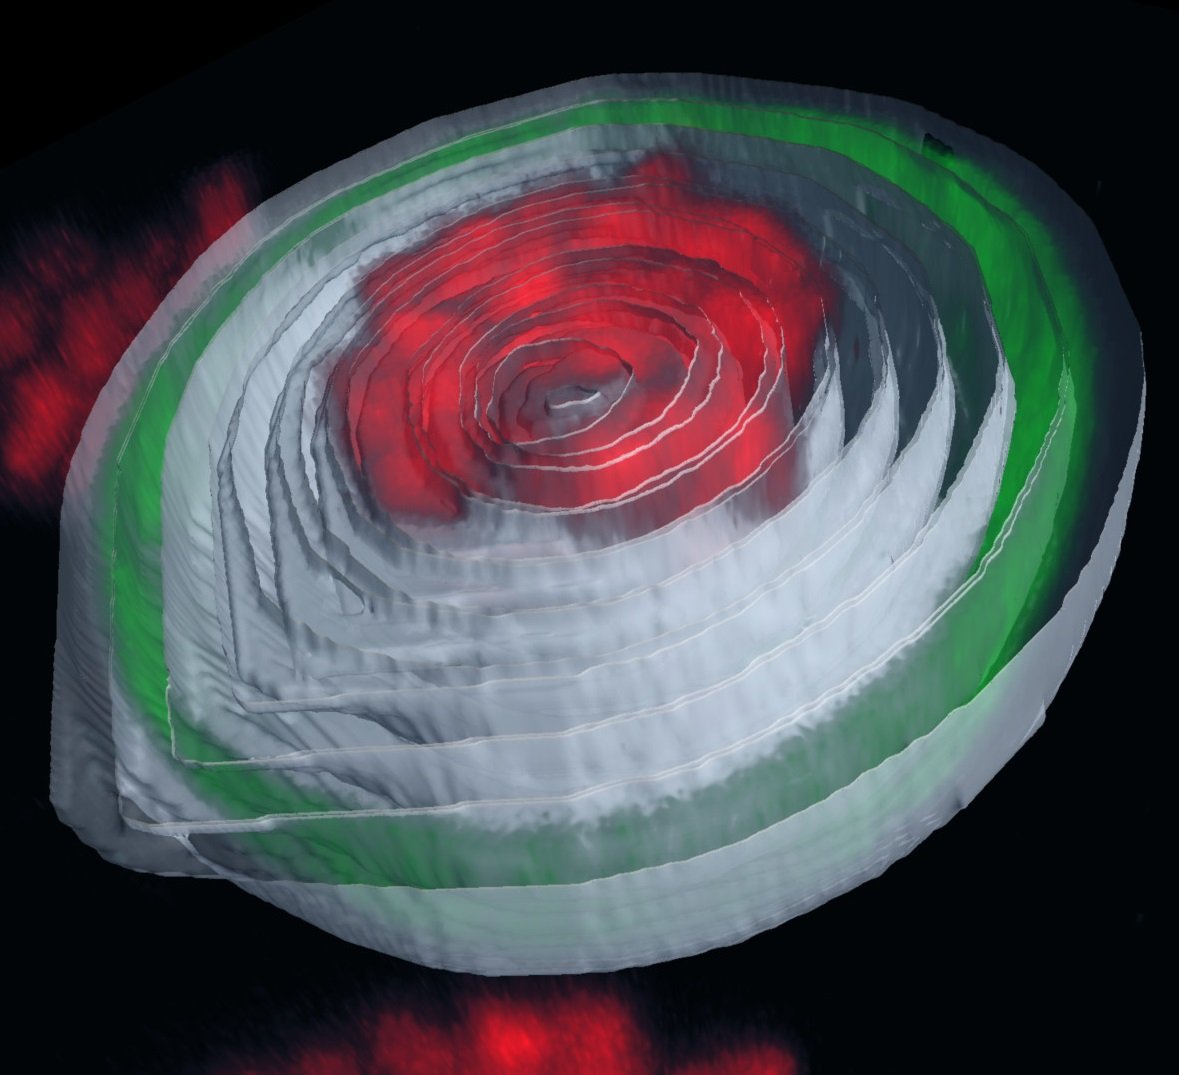
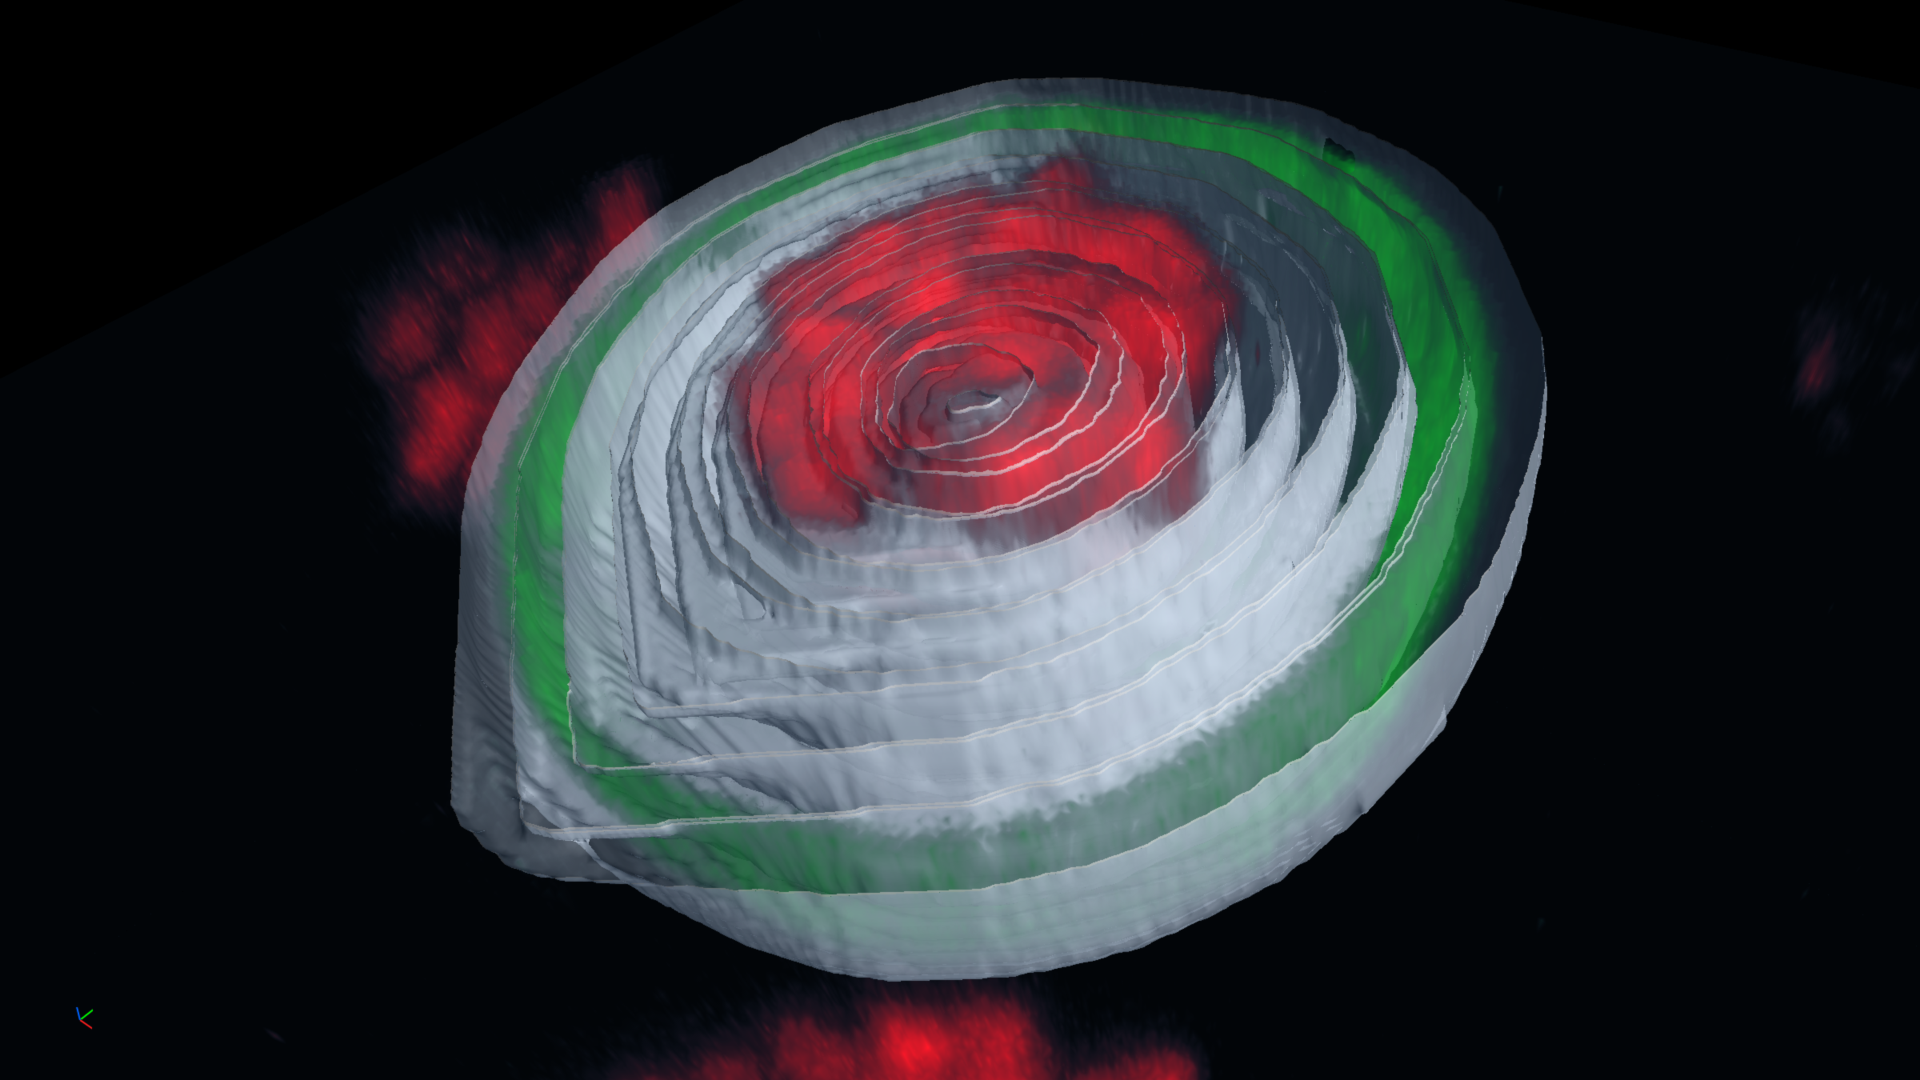
Image courtesy: Amiad Pavlov et al.  3D view of a live nucleus, overexpressing lamin C, cut through the middle. Chromatin is labeled with His2B-mRFP and nuclear envelope with lamin C–GFP. The segmented nucleus is divided into 10 concentric 3D radial shells (gray) for quantification of radial chromatin distribution. 

How to Succeed with 3D Distribution Analysis:

Challenges and advantages:

  • Signal distribution analysis is not a straight-forward analysis since most commercial software only offers the possibility to quantify the total signal inside an object and not how it is actually distributed
  • ZEISS arivis Pro allows the addition of Python scripts within your image analysis pipeline enabling users to combine existing image analysis tools with custom designed scripts
  • By incorporating the Python script within the pipeline, you can also batch process many datasets while also including the Python script
 
How to plan your workflow:
  • This type of analysis is ideal to quantify distribution of signal within spherical objects like nuclei and cells
  • When segmenting the main envelope, make sure that there are no holes in order to correctly create the “Russian dolls” and avoid creating a doughnut structure
  • If the segmentation of the outer envelope cannot be done automatically, it can also be defined with the manual drawing tools


This tutorial gives an overview of how to use  ZEISS arivis Pro (formerly Vision4D) to run a Matryoshka analysis.

For more information on accessing the Matryoshka Python script, please visit the arivis Knowledge Base.

Image Analysis Workflow for 3D Distribution Analysis

Pre-Processing

ZEISS arivis Pro (formerly Vision4D) pre-processing tools can help with reducing noise and filling in gaps in the envelope. If your nucleus or cell has a homogeneous signal you may not need this step.

Segmetation

Segment the nucleus or cell and remove any smaller objects.  The concentric shells will be generated from this segment.

Python Operator

Add the Python operator and select the Matryoshka script. Search the arivis Knowledge Base on how to install a Python environment inside of  ZEISS arivis Pro (formerly Vision4D).

Exporting

Add exporting operators if you want to automatically generate an excel file with results and run the pipeline over the whole data set. 

Reference


Research Paper: Daria Amiad-Pavlov, Dana Lorber, Gaurav Bajpai, Adriana Reuveny, Francesco Roncato, Ronen Alon, Samuel Safran and Talila Volk. Live imaging of chromatin distribution reveals novel principles of nuclear architecture and chromatin compartmentalization. Science Advances 02 Jun 2021: Vol. 7, no. 23, eabf6251.

DOI: 10.1126/sciadv.abf6251